
A comparison of VO Health’s blood-based Molecular Fitness Test against the range of VO₂ max estimates from my last post, plus an unexpected cross-check against DEXA body composition data.
In the first two posts of this series, I described the natural experiment that recovery from illness created and the growing menu of ways an amateur athlete can estimate VO₂ max without ever setting foot in a physiology lab. This post is about the one method that doesn’t involve exercising at all.
VO Health’s Molecular Fitness Test estimates cardiorespiratory fitness from roughly 50 proteins in a single blood draw, using no treadmill, no bike, and no maximal effort. As noted in the first post, VO Health is a partner supporting this project and providing the biomarker testing discussed here; I’m evaluating their data on the same terms as everything else in this series. I completed my first VO Health panel on July 21. I also completed a whole-body DEXA scan on September 7, which turned up an unexpected point of agreement with the blood panel worth addressing here.
What the Blood Test Reported
The Molecular Fitness Report returns two headline numbers and a ten-pathway biological “fingerprint.”
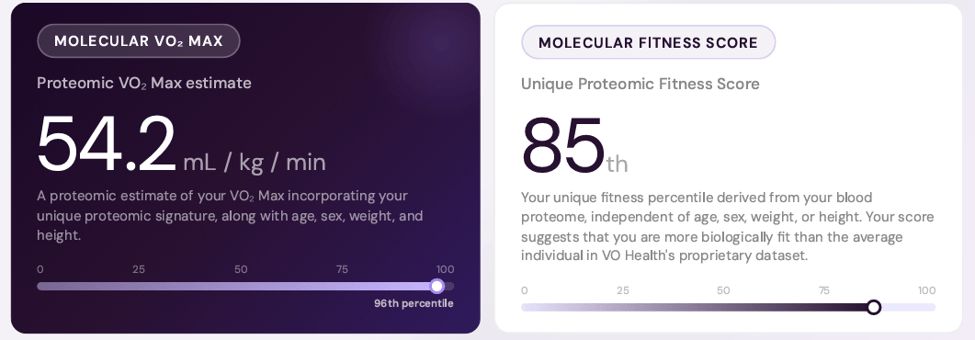
- Molecular VO₂ Max: 54.2 mL/kg/min — reported at the 96th percentile for my age and sex
- Molecular Fitness Score: 85th percentile — a proteomic fitness percentile that VO Health describes as independent of age, sex, weight, or height
Underneath those two numbers sits a radar chart of ten pathways — inflammation, angiogenesis, hormonal signaling, fat metabolism, tissue repair, carbohydrate metabolism, oxidative stress, protein metabolism, muscle and vascular signaling, and oxygen transport — each scored from 0 to 1 relative to VO Health’s reference population. Carbohydrate metabolism (0.78) and protein metabolism (0.78) scored highest. Angiogenesis (0.28) and muscle and vascular signaling (0.29) scored lowest, well below every other pathway on the chart.
That last detail turned out to matter more than I expected once I had another data source to compare it against.
Comparing Notes with My Other VO₂ Max Estimates
In the last post, I lined up five VO₂ max estimates derived from wearables and cycling performance tests — Apple, WHOOP, a Peloton ramp test, functional threshold power, and critical power — none of which came from direct gas-exchange measurement. Those estimates ranged from 42 to 62 mL/kg/min. The ramp test sat toward the high end, reflecting strong short-duration maximal capacity. The FTP- and critical-power-derived estimates sat lower, suggesting my ability to sustain a high proportion of that capacity might still be developing. Apple and WHOOP landed between those extremes and agreed closely with each other.
The Molecular VO₂ Max of 54.2 mL/kg/min falls comfortably within that same range, close to the estimates derived from Apple and WHOOP. That’s a reasonable place for an independent method to land, given how much spread already existed among the others. It doesn’t resolve which estimate is closest to the truth, but it’s a useful data point to carry forward once I have a direct CPET measurement to anchor all of them against, and it appears to agree with the wearable estimates.
An Unexpected Cross-Check: The DEXA Scan
The more interesting finding wasn’t actually the VO₂ number at all. It showed up when I compared the blood panel’s pathway fingerprint against an entirely different test: whole-body DEXA imaging.
My DEXA scan gave me an overall score of A+, with 14.5% body fat, visceral fat of 0.48 lbs, and a strong T-score for bone density (1.40). By most composite measures, the DEXA data describes a very fit, low-risk profile, consistent with the blood test’s optimistic framing of my health.
But one number stood out: my Appendicular Lean Mass Index (ALMI) was 7.81 kg/m², flagged as “below average” relative to DEXA’s reference population, against a target of 9.5. Also, my Fat-Free Mass Index (FFMI) came in at 18.5 kg/m², just in the average range. In plain terms: for someone with a decent overall fitness profile, my arm and leg muscle mass is comparatively modest.
Now go back to the blood test’s weakest two pathways: angiogenesis (proteins tracking new blood vessel growth to deliver oxygen to muscle) and muscle and vascular signaling (proteins reflecting how well the heart, vessels, and muscles coordinate, including muscular work). Both scored far below every other pathway on the panel, in a report that otherwise painted an above-average picture.
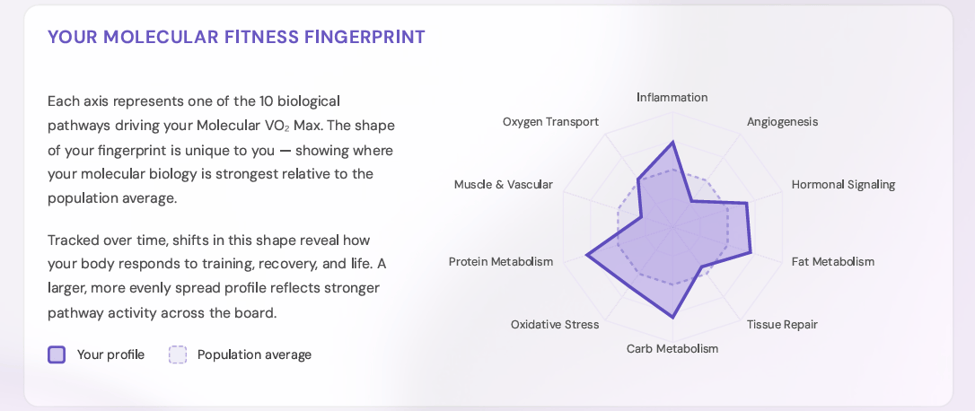
Two completely different technologies — a blood proteome panel and a whole-body imaging scan — converged on the same underlying signal: strong aerobic engine, comparatively underdeveloped muscular and vascular periphery. That kind of agreement across independent methods is exactly the sort of information I was hoping this series would surface, and it’s more convincing to me than either result in isolation.
How Useful Is This for Training?
Given all of that, here’s my honest assessment of what this test can do for an amateur athlete training around a full-time job.
On the VO₂ max estimate itself: 54.2 sits close to where my Apple and WHOOP estimates already clustered, and within the broader range established by my wearables and cycling tests. It doesn’t add much clarity about which of those numbers is closest to the truth (that will take a direct CPET measurement to anchor everything else against, which I have scheduled soon). But the fact that it lines up with the wearable-derived estimates at all is notable given how different the underlying methods are: no heart-rate sensor, no GPS, no requirement to complete a qualifying workout, just a single blood draw.
That last point matters more than it might seem. Every other VO₂ max estimate in this project required some form of exertion — a maximal or near-maximal effort, a qualifying outdoor workout, or a structured cycling test. The blood test needed none of that. For someone starting from a lower fitness baseline, recovering from illness or injury, or simply unwilling or unable to complete a maximal effort test, a proteomic estimate that tracks reasonably well with wearable-based numbers could be a genuinely useful entry point — a way to get a baseline fitness read before a person is fit enough, motivated enough, or medically cleared to attempt other forms of active testing.
There may be other advantages to skipping exercise entirely, beyond accessibility. A blood draw removes the day-to-day variability that comes with motivation, sleep, recent training load, heat, hydration, and pacing strategy — all of which can meaningfully shift the result of an effort-based test on a given day. It’s not obvious yet whether the biomarkers themselves are more stable than an effort-based measurement over short timescales, but it’s a plausible advantage worth testing for, and it’s part of why the longitudinal comparison ahead will be informative.
Where it’s more interesting: the angiogenesis and muscle/vascular signal pointed me toward the same conclusion my DEXA scan did, that strength work and muscle-building stimulus deserve more room in my program than my aerobic-only race prep would otherwise allocate. I wouldn’t have gone looking for that from an endurance-focused training log, and having two independent methods point to the same finding makes it a more credible input than a single metric on its own.
This is worth noting, because it’s genuinely something I’ve overlooked. My training for this race, and for most of my amateur racing before it, has been almost entirely aerobic: swim, bike, and run, with essentially zero dedicated strength work, unfortunately. That’s a common blind spot for endurance athletes and seeing data sources flag that gap is a convincing prompt to change behavior.
It also matters beyond this race. Lean mass and muscular strength are directly tied to long-term health, not just performance: they’re central to preventing sarcopenia and frailty as I age, they support metabolic health and bone density, and appendicular lean mass has been associated with mortality and disability risk independent of cardiorespiratory fitness. An excellent VO₂ max doesn’t offset a comparatively underdeveloped muscular system. Prompting an actual strength-training habit rather than continuing to skip it in favor of more aerobic volume is a meaningful, actionable outcome from this test. Arguably more useful to my long-term health than a very precise VO₂ max number would be.
Where We Go From Here
Next up: a lab-based CPET compared against my most recent blood draw, plus how the Molecular Fitness panel and my other measurements change across follow-up timed to specific blocks of Ironman training. I’ll compare how the Molecular VO₂ Max, Fitness Score, and pathway fingerprint adjust to my actual training load, field tests, and subjective performance in upcoming posts.
That’s ultimately a more important question than “is 54.2 the right number.” Directional accuracy and reproducibility over time will tell me more about whether this belongs in my regular toolkit than any single point-in-time comparison can.
IStay tuned!
If you’re interested in VO Health’s biomarker profiling, you can sign up for their beta testing waitlist here: https://vohealth.co/waitlist.
You can also sign-up for This Week in Cardiovascular AI, a separate newsletter that comes out on a bi-weekly basis and will contain updates on this project.


